Blog
Why Is Demand Flexibility Essential?
January 19, 2023
Share
Energy efficiency (EE) and demand response (DR) are demand side management (DSM) approaches that have existed for decades. However, there’s a newer DSM approach that seeks to combine the best of EE and DR – demand flexibility. Demand flexibility is the changing of electricity consumption patterns by reducing, shedding, shifting or modulating loads. Examples include:
- Reducing: repairing broken dampers and sensors, adjusting scheduling based on occupancy
- Shedding: dimming lights, adjusting air temperature by two degrees
- Shifting: precooling buildings in the summer before afternoon peak, preheating hot water heaters during off-peak periods
- Modulating: controlling fan or pump speeds in response to a grid signal.
Why is demand flexibility essential? As our grid rapidly evolves, we need to find ways to better match renewable energy generation with energy demand. Demand flexibility reduces carbon emissions, overall system costs, and increases reliability by avoiding system capacity constraints, at generation, transmission, and distribution levels.
Carbon
The carbon intensity of electricity varies by generation source, leading to significantly different carbon intensities by location, season, and time of day. Renewable energy resources dominate new generating capacity. In the US in 2021, wind and solar capacity dominated new generating capacity, accounting for 41% and 36%, respectively[1]. The energy source being used at a specific time, as well as peak system demand (see next section), impact the amount of carbon emissions per megawatt-hour (MWh). As more renewables come online, the hourly emissions factor discrepancies will only continue to increase (at least until there is more utility-scale storage online). Figure 1 shows the variation in marginal carbon emissions on an hourly basis for Illinois in 2022. The green represents relatively lower hourly average emissions per MWh and the red represents the highest emissions.
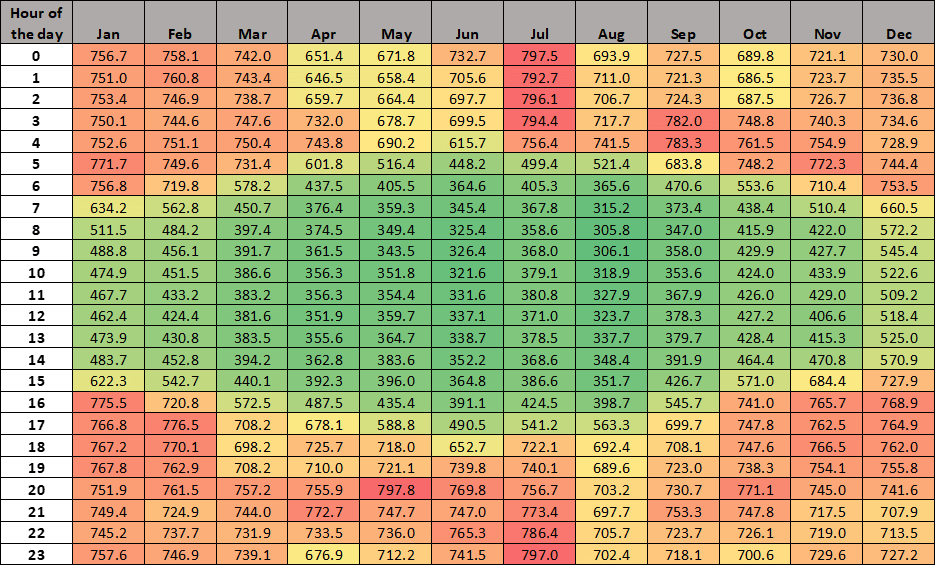
Figure 1: Long-run marginal CO2 emission rate pattern (kg/MWh) for Illinois, mid-case scenario of the 2022 Standard Scenarios data set. Source: https://www.nrel.gov/analysis/cambium.html
Standard energy efficiency programs do not take marginal emissions rates into consideration. There is a large opportunity for expanding EE programs to have a greater impact on electric sector emissions. In the case of Illinois, a one kilowatt-hour (kWh) reduction in load at 8 pm will reduce carbon emissions by a factor of 2.3x compared to a one kWh reduction at noon. Additionally, demand response events are not utilized to target the reduction of carbon emissions.
Peak System Demand
In the last decade, per capita energy use has fallen 5% in the United States[2]. This is due mainly to energy efficiency and warmer weather. However, peak system demand has not similarly decreased. In ISO New England territory, for instance, annual energy use is lower now than it was in the early 2000s. Peak system demand, however, remains relatively constant, as seen in Figure 2. The grid system therefore needs to continue to be prepared to meet peak system demands which are significantly higher than average consumption. This capacity is often met by expensive natural gas peaker plants with significantly higher emissions factors which are activated to meet system peaks.
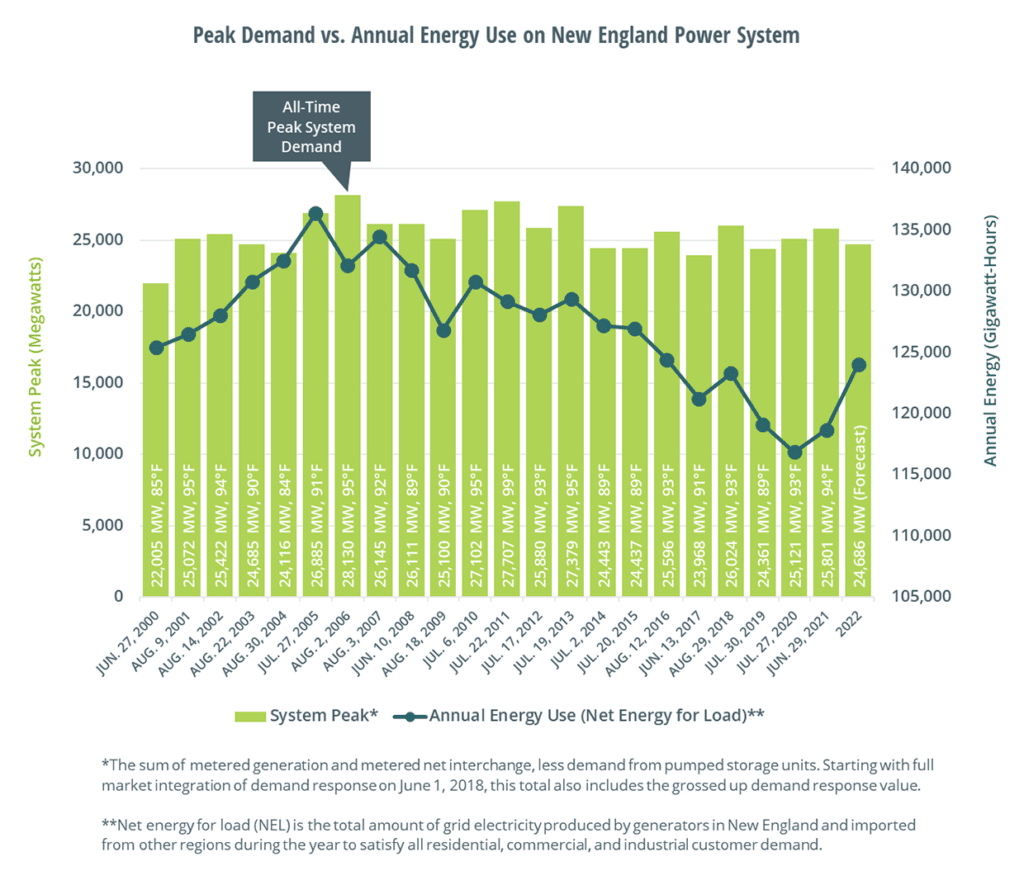
Figure 2: Peak demand vs annual energy use in New England. Source: ISO New England[3]
The grid system needs to be prepared to meet system demand peaks at all levels. Generation is changing as more utility-scale renewable energy comes online and as more distributed energy resources (DERs) are installed. Transmission lines need to be added to transport energy from solar and wind farms far from high-demand areas. Finally, distribution infrastructure is being challenged due to new, localized distribution peaks.
Electrification, driven by electric vehicles (EVs) and heat pumps, is expected to cause increased peak system demand and overall demand. A BCG study[4] estimated that, for a model utility of 2-3 million customers, there will be 1.1 million EVs in service by 2030. The utility will need to make cumulative transmission and distribution investments of $2.8 billion through 2030.
Increased peak system demand also causes higher electricity prices. Figure 3 shows the September 2022 range of wholesale electricity prices compared to the previous year’s range of prices for selected regional trading hubs. A September 2021 extreme heat event, one of the hottest weather events on record in the Northwest, sent peak system demands to new highs. The high peak system demand coupled with high natural gas prices drove wholesale prices to $1,040/MWh[5], as seen in Figure 3.
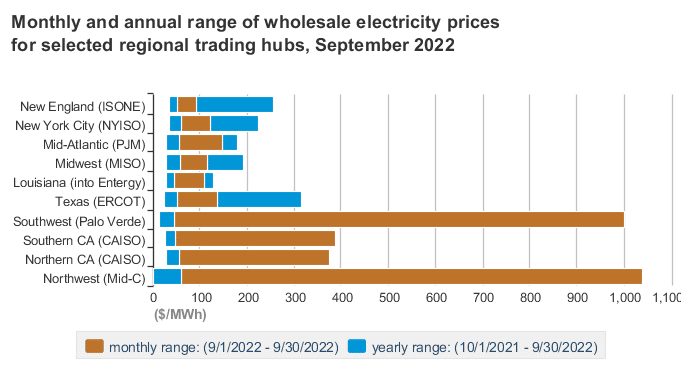
Figure 3: Wholesale regional electricity prices, Sept 2022. Source: US EIA based on SNL Energy
Increased electricity costs due to peak system demand are currently built into the overall rate structure. During 2021, peak system demands during extreme weather events and high natural gas prices led US retail electricity prices to rise at the fastest rate since 2008[6]. As the cost of meeting peak system demand continues to increase, consumer rates continue to increase.
Demand Flexibility
Demand flexibility, or demand optimization, offers an opportunity to address carbon emissions and peak system demand challenges in a way that traditional energy efficiency and demand response cannot. The Department of Energy estimates that flexible efficient buildings could decrease carbon emissions by 80 million tons per year by 2030[7]. Efficient flexible buildings could also save $100–200 billion in U.S. electric power system cost savings over the next 20 years.
Timing, duration, and location are what make demand flexibility unique when compared to energy efficiency and demand response. Energy efficiency reduces total energy consumed but does not necessarily address times of high carbon intensity or peak system demand. Demand response often targets peak system demand but for limited periods and a limited number of annual events. Neither energy efficiency nor demand response was used to target load alleviation at a distribution level. Utilities have not had sufficient control and visibility into load to utilize traditional DSM programs as non-wires alternatives to distribution infrastructure.
The optimization of demand requires solving a time series problem. This is a problem that is faced by grid operators, utilities, and those flexing load at a building level. To solve the time series problem at a building level, demand flexibility forecasting requires multiple types of forecasts including:
- Weather
- Building level
- Electricity demand
- Available demand flexibility
- Equipment Level
- Demand flexibility measure impact
- Thermal response of space.
Figure 4 demonstrates how demand flexibility can work in action, in response to a call to flex load in a commercial building. Fifty percent of load is shifted to the nighttime period. Fifty percent of load is shed through e.g., changing space temperature setpoints, dimming lights in unused rooms, changing chilled water temperature setpoints, and engaging energy storage systems. All of this must be done while maintaining occupant comfort.
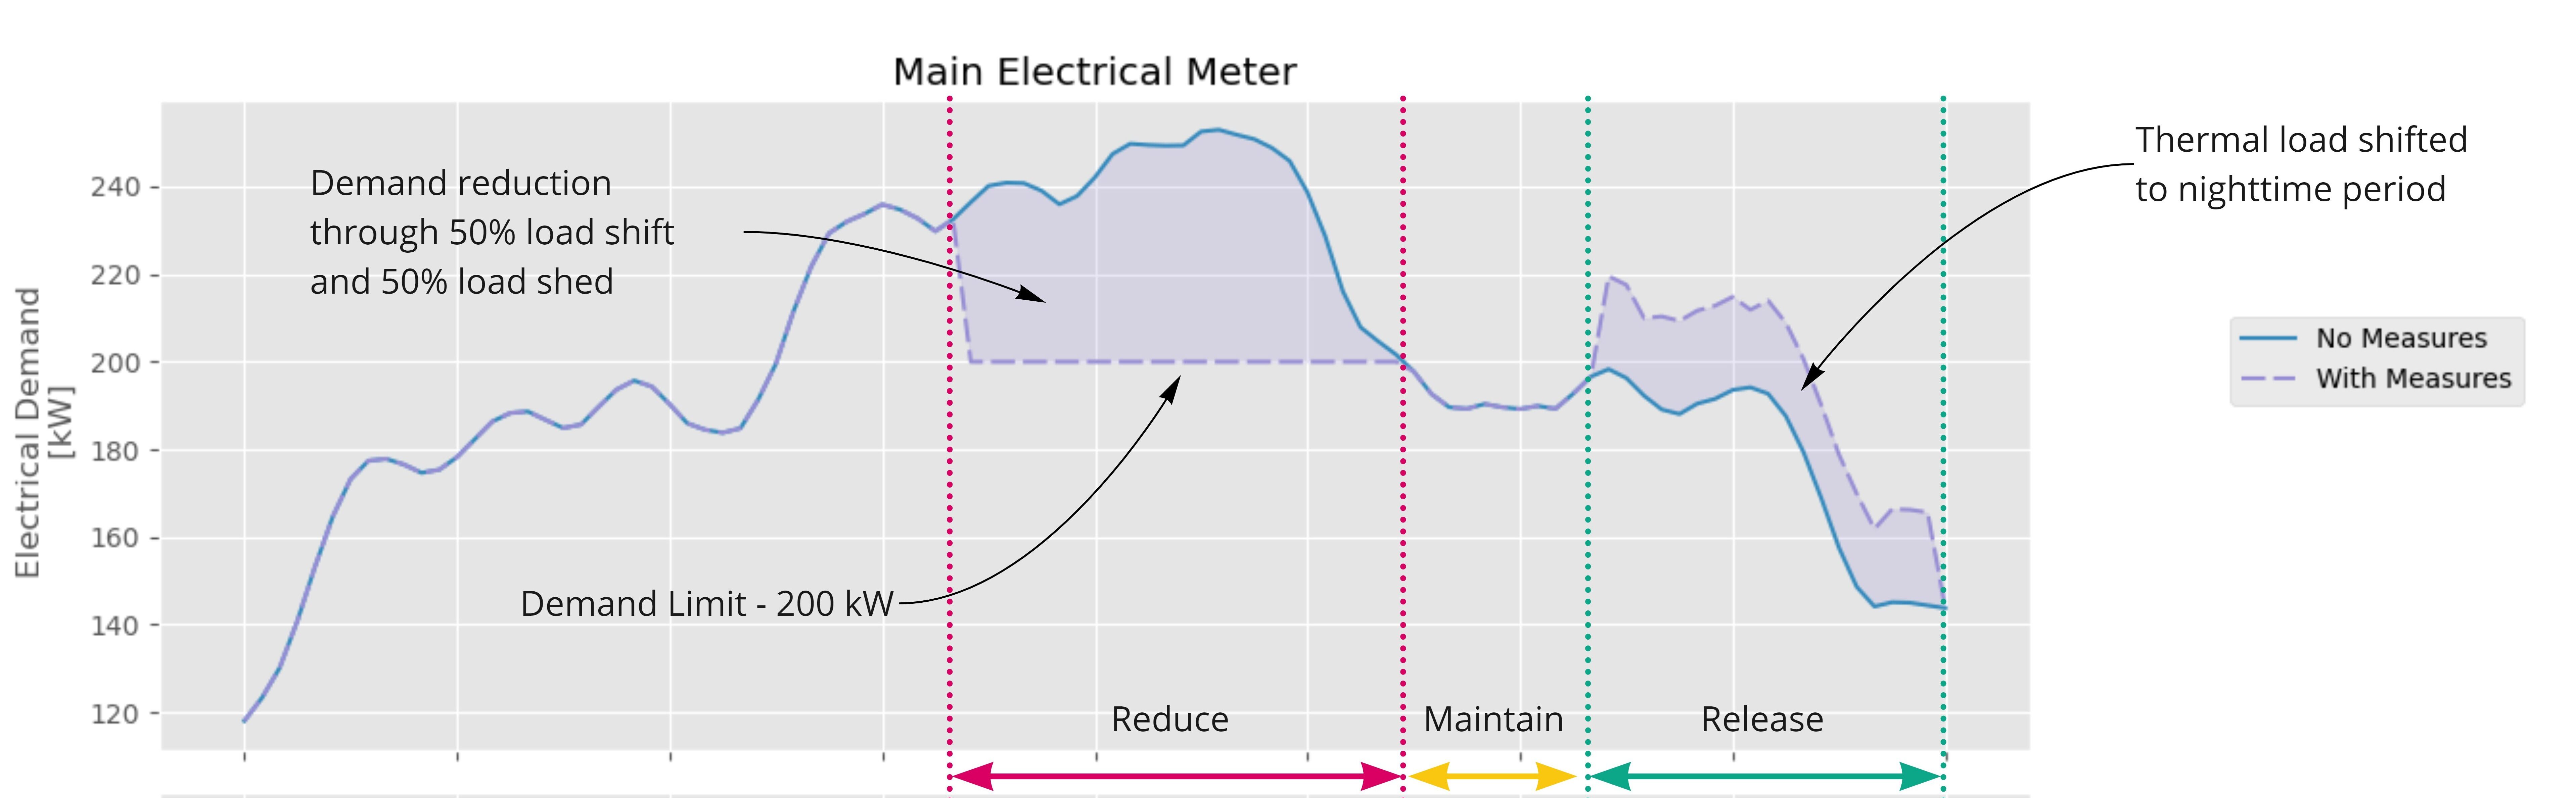
Figure 4: Demand with and without flexibility measures. Source: James McNeill, Edo
Permanently reducing peaks and temporarily shedding and shifting load can be implemented in a way that reduces carbon emissions and peak system demand. Demand side management evolves from being a blunt instrument to one that can be used to target times of peak carbon emissions and peak system demands.
About Edo
Edo provides utilities with a demand flexibility offering for commercial buildings. Our data gateway pulls from all data sources in the building including meters, existing building automation systems (no replacements needed), occupancy sensors, and distributed energy resources (DERs). Our machine learning forecasts and autoclassification tools are trained on the data from more than 3000 buildings. We first implement energy conservation measures in partnership with facility managers. Once we understand the building’s operations and load, we engage buildings in demand flexibility.
[1] https://www.spglobal.com/marketintelligence/en/news-insights/latest-news-headlines/nearly-28-gw-of-new-us-generating-capacity-added-in-2021-led-by-wind-68435915#:~:text=The%20U.S.%20added%2027%2C959%20MW,to%20the%20U.S.%20power%20grid.
[2] https://www.eia.gov/todayinenergy/detail.php?id=49036
[3] https://www.iso-ne.com/about/key-stats/electricity-use/
[4] https://www.bcg.com/publications/2019/costs-revving-up-the-grid-for-electric-vehicles
[5] https://www.eia.gov/electricity/monthly/update/wholesale-markets.php
[6] https://www.eia.gov/todayinenergy/detail.php?id=51438&
[7] https://gebroadmap.lbl.gov/